
Contents:
Prediction of life expectancy in 2023.
Project description:
The term “life expectancy” refers to the number of years a person can expect to live. By definition, life expectancy is based on an estimate of the average age that members of a particular population group will be when they die.
Life expectancy depends on several factors, the two most important being gender and birth year. Generally, females have a slightly higher life expectancy than males due to biological differences. Other factors that influence life expectancy include:
- Race and Ethnicity
- Family Medical History
- Risky Lifestyle choices
However, that’s hardly the entire list! As we work our way through the data analysis, we will explore additional hidden factors that influence the life expectancy of an individual.
Project Technical Details:
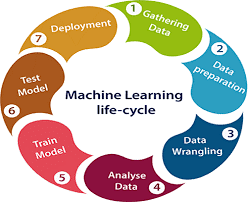
The following diagram shows the various steps that we have followed in our project.
- Data collection:
For this demonstration, we make use of the Life Expectancy (WHO)
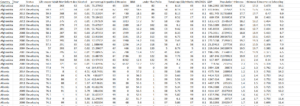
- There are 21 features available in the dataset and 2938 Observations.
- Since the data in filled with lot of NaN or null values so we have to work on it.
- Checked the null values or missing values in the dataset. Performed data imputation, filled null values with median and mode.

A simple visualization of nullity by column
4. Considered the main 18 features such as [‘Country’, ‘Year’, ‘Status’, ‘Life expectancy ‘, ‘Adult Mortality’, ‘infant deaths’, ‘Alcohol’, ‘percentage expenditure’, ‘Hepatitis B’, ‘Measles ‘, ‘ BMI ‘, ‘under-five deaths ‘, ‘Polio’, ‘Total expenditure’, ‘Diphtheria ‘, ‘ HIV/AIDS’, ‘GDP’, ‘Population’, ‘ thinness 1-19 years’, ‘ thinness 5-9 years’, ‘Income composition of resources’, ‘Schooling’].
5. Displaying unique values of all the categorical data.
6. Detecting the outliers in our dataset for each column.
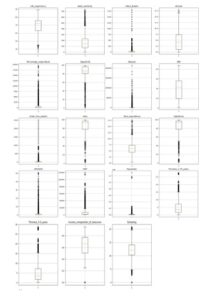
7. Infant_Deaths represents several infant deaths per 1,000 population. That is why the numbeyond 1000 is unrealistic. We will therefore remove them as outliers. The same is true for measles and deaths under five, as both are a number per 1,000 population.
As we can see, some countries spend up to 20,000% of their GDP on health. Most countries spend less than 2,500% of their GDP on health. Since the values are very important in the Expenditure_Percentage, GDP, and Population columns, it is better to take a logarithmic value or use winsorization if necessary.
The BMI values are very unrealistic because the value plus 40 is considered extreme obesity. The median is over 40 and some countries have an average of around 60 which is not possible. We can delete this whole column.
As almost all other columns have outliers, we can use winsorization:
We have to check the correlation of each column with respect to each.
2. Life Expectancy Analysis:
Now we have done all the data cleaning and we also have removed all the outliers in the dataset. Now let’s see move forward with the task of Life Expectancy Analysis. Let’s start by exploring the data and looking at the correlation:
Observations from the above correlation:
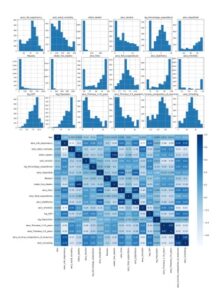
- Adult_mortality has a negative relationship with education, the composition of resource income, and a positive relationship with HIV / AIDS.
- Infant_deaths and Under_five_deaths have a strong positive relationship.
- Schooling and alcohol have a positive relationship.
- Percentage expenditure has a positive relationship with education, the composition of resource income, GDP and life expectancy.
- Hepatitis B has a strong positive relationship with polio and diphtheria.
- Polio also has a strong positive relationship with diphtheria, hepatitis B, and life expectancy.
- Diphtheria has a strong positive relationship with polio and life expectancy.
As we can see from the heat map, Life_expectancy has a positive relationship with education, resource income composition, GDP, diphtheria, polio, and percentage spending. Life_expectancy has a negative relationship with Adult_mortality, Thinness_1-19_years, Thinness_5-9_years, HIV / AIDS, Under_five_deaths, and Infant_deaths. Let’s explore them in detail to conclude the task of life expectancy analysis.
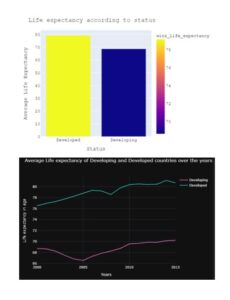
We can see from the two graphs above that developed countries have more life expectancy than in developing countries.
- Model building:
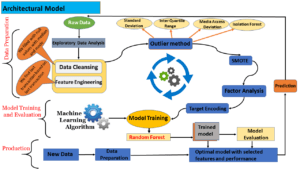
Selected model: Random Forest
Using Lazy classifier techniques various machine learning algorithms were explored such as KNN, Ada Boost, Decision Tree, ensemble techniques , the model that gave the highest accuracy is Random Forest.
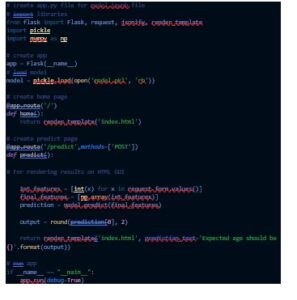
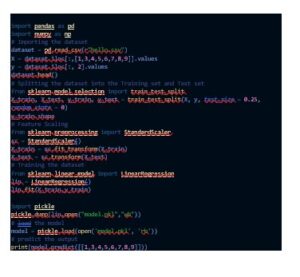
Life expectancy prediction uses the following packages and library from python:

OUTPUT :


