Project description:
Prediction of estimated carbon dioxide emissions is an important problem due to the vulnerabilities associated with it. With the arising issues of global warming it is important that we monitor our carbon emission. Techniques of multiple linear regression and predictive analysis are used to predict the carbon dioxide emissions.
Identification of features responsible for carbon dioxide emissions will help car manufacturers and buyers take necessary actions to rectify it and to overcome the risk of global warming, black smoke emission, etc.
This project deals with the problem of increase in the carbon dioxide emissions in Canada due to the increase in the number of car purchases. We analyze the different car models currently active in the country and on the basis of the analysis figure out the key factors responsible in the increase in carbon dioxide emissions.
Project Technical Details:
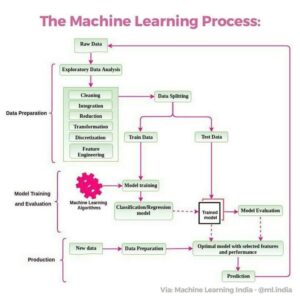
The following diagram shows the various steps that we have followed in our project.
fig 1: General steps of CRISP DM process
- Data collection:
We collected a dataset that consists of both categorical and numerical data. The features in this dataset points towards the different factors that contribute towards the amount of carbon dioxide emissions.
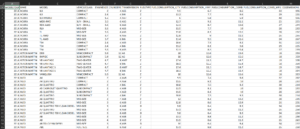
- There are 13 features available in the dataset and 1068 Observations.
- Checked the null values or missing values in the dataset. Performed data imputation, filled null values with median and mode.
- The information in the feature TRANSMISSION are combined to more generalized groups such that its easier to perform EDA. (For e.g.- “A1”, “A2”, “A3”, “A4”, “A5” and “A6” are all changed to “automatic”)
- There are 13 Features and based on characteristics and values, the following features have been dropped.
MODELYEAR
- The 5 features: MAKE, MODEL, VEHICLECLASS, TRANSMISSION and FUELTYPE are categorical variable and hence used for EDA only, they play no role in multiple linear regression.
- The remaining 7 features: ENGINESIZE, CYLINDERS, FUELCONSUMPTION_CITY, FUELCONSUMPTION_HWY, FUELCONSUMPTION_COMB, FUELCONSUMPTION_COMB_MPG and CO2EMISSIONS are continuous data and hence used for multiple linear regression.
- Performing univariate analysis and bivariate analysis on the categorical variable.
- We analysed the numeric features and figured out the outliers, skewness of them.
- We found out the correlation matrix of the continuous data to find out how the features are interdependent on each other.
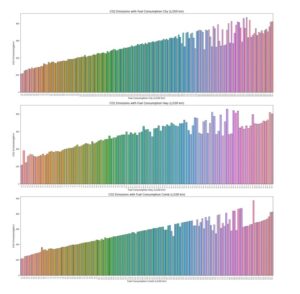
- Analyzed the variation of CO2 emission with all the other continuous data to find out the best input variables for our model.
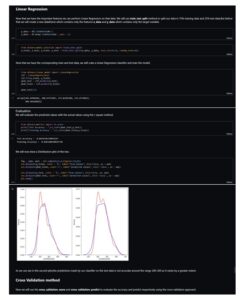
- We then generate our multiple linear regression model for the remaining features.
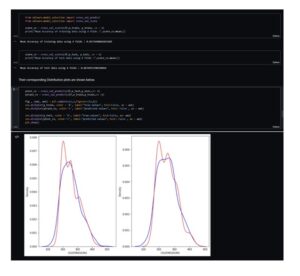
- We test our model.
2. Exploratory Data Analysis:
Analysis were done on the basis of several charts which are shown below:
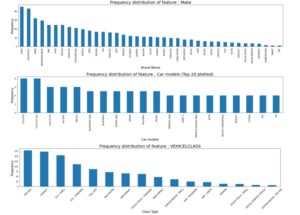
Inferences from the above charts:
- Out of the 42 car brands Ford(628) and Chevrolet(588) are the most dominating ones. Whereas cars of Smart(7), Bugati(3) and SRT(2) are the ones with lowest frequency.
- SUV-Small(1217) and MID-Size(1133) vehicles are the most frequent ones on Canadian roads.
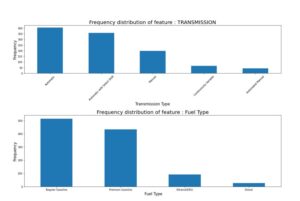
- Frequency of car with Transmission type Automatic with Select Shift(3127) is the highest and with Continuously Variable Transmission(576) is the lowest.
- Car which runs on Gasoline let it be Regular(3637) or Premium(3202) is the most common vehicle type. And cars running on Diesel(175) are very low in frquency and there is only one sample which uses Natural Gases.
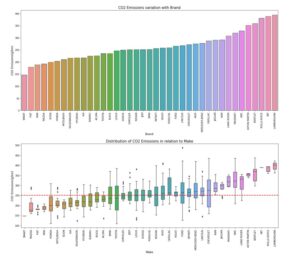
- From both the bar graph and the box plot it can be inferred that average CO2 emissions of cars belonging to the brand Bugatti is the highest and cars of SMART has the lowest emissions.
- The red line signify the sample mean of CO2 emissions.
- Almost 50% of the brand has their median CO2 emissions less than the sample median of CO2 emissions by all the cars.
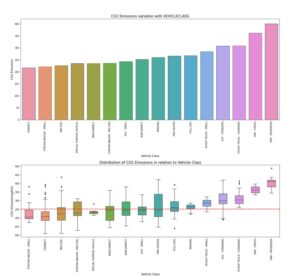
- The vehicle of class VAN-Passenger followed by VAN-Cargo has the highest CO2 emissions among all. And Station Wagon-Small has the lowest CO2 emissions.
- There are 8 types of vehicle class out of 16 which has a median CO2 emissions less than sample median of CO2 emissions and the other 8 has a higher median.
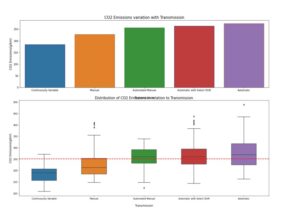
- Vehicles with Automatic transmission exhibit highest CO2 emissions and vehicle with Continuously Variable Transmission shows the lowest CO2 emissions.
- Median CO2 emissions of Automated Manual and Automatic with Select Shift vehicles is almost similar to that of sample median CO2 emissions.


- Cars running on Ethanol(E85) has the highest CO2 emissions with almost all the values hisger than the sample median CO2 emissions.
- Natural Gas has the lowest CO2 emissions, but there is only one vehicle that use it as fuel. Other than that Regular Gasoline has the lowest CO2 emissions with almost 75% values less than sample median.
- The median CO2 emissions of fuel type Premiuim Gasoline and Diesel has almost similar median to that of the sample median.
Analyzing the numerical features:

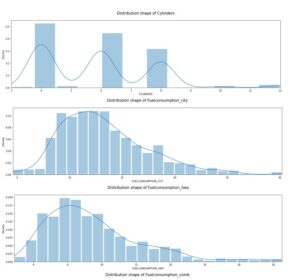
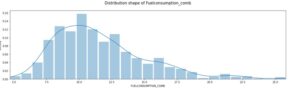
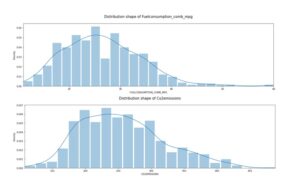
- Cylinder feature has discrete values so it is the most positively skewed distribution.
- CO2 Emission in turn is the one which looks more similar to a normally distributed curve than the others.


From the Box plot we can infer
- The minimum value of the CO2 emission is around 96.
- The median CO2 emission is 246.
- The 25% of the samples have CO2 emission between 96 and 208.
- The 75% of the samples have CO2 emission between 96 and 288.
- There are no outliers in the lower half but there are outliers in the upper half.
- The maximum CO2 emissions observed is 522 which is an outlier.
- The distribution of CO2 emissions is positively skewed.

- Fuel Consumption Comb (mpg) is negatively correlated to all the features.
- All the other features are postively correlated with each other.
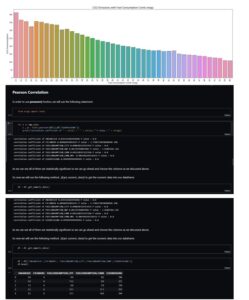
- Both Fuel Consumption City (L/100 km) and Fuel Consumption Hwy (L/100 km) have very strong positive correlation of 0.99 and 0.98 with Fuel Consumption Comb (L/100 km), since Fuel Consumption Comb (L/100 km) is redundant.
- Our dependent variable CO2 Emissions(g/km) has highest positive correlation of 0.92 with Fuel Consumption City (L/100 km) and Fuel Consumption Comb (L/100 km) and strong negative correlation of -0.91 with Fuel Consumption Comb (mpg).
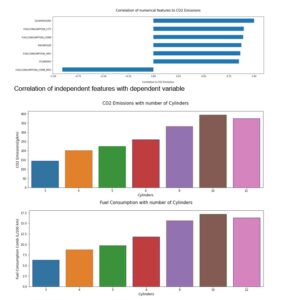

Correlation of independent features with dependent variable
- With increase in number of Cylinders, CO2 emissions also increase proportionally.
- The same trend can be observed for Cylinder vs Combined Fuel Consumption. And since Combined Fuel Consumption is strongly postively correlated with CO2 emissions, so with increase in number of cylinders, CO2 emissions also increases.
- Vehicles with number of cylinders more than 5 has a median CO2 emissions greater than the sample median CO2 emissions.
- Vehicles with less than 6 cylinder have almost all the sample with median CO2 emissions less than sample median.
- Whereas vehicles with more than 5 cylinders have almost 100% sample with median CO2 emissions more than the sample median.

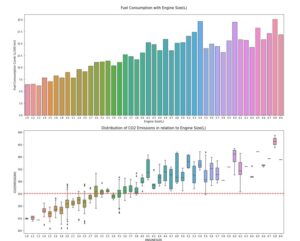
- With increase in Engine Size, CO2 emissions also increases.
- The same trend can be observed for Engine Size vs Combined Fuel Consumption also. And since Combined Fuel Consumption is strongly postively correlated with CO2 emissions, so as Engine Size increases CO2 emissions also increases.
- Vehicles with Engines Size more than 2.5L has a median CO2 emissions greater than or equal to the sample median CO2 emissions.
