What is Outlier:- An outlier is a data in a dataset that is far away from the other data present in the dataset.
For Example:-

As you can see in the above photo a bird is far away from the other crowd of birds it is same in the dataset.
Why do the Outlier Occur:- It occurs due to the variance in the dataset .They may occur due to the skewness because if there is a skewness so there is always an outlier in the dataset.
How we can detect outlier in the dataset:- We can detect the outlier from the techeniques given below
1.Boxplot
2.Inter Quantile Range(IQR)
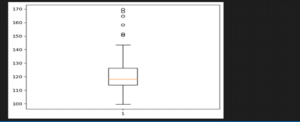
1.Boxplot:-

As you can see a circles in the above barplot they are the outliers .
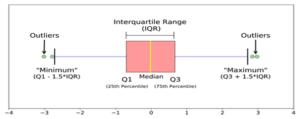
2.Inter Quantile Range (IQR):-

The data points that lie 1.5 times of IQR above Q3 and below Q1 are outliers.
Steps to find the outlier
Make the dataset in ascending order
Then calculate the 1st and 3rd quartiles(Q1, Q3)
Then compute IQR=Q3-Q1
Then compute lower bound = (Q1–1.5*IQR), upper bound = (Q3+1.5*IQR)
Check the values of the dataset for those who fall below and the lower bound and above the upper bound and we can say them as outlier.
How to deal with the Outliers:- We can deal with the outliers with the following methods:-
1.Removing the Outlier:- In this we remove the outlier from the dataset
2.Quantile based Flooring and Capping:- In this the value is above the 90 percentile and below the 100 percentile value given in the dataset.
3.Imputation of Mean / Median:- In this we replaced the outlier with the median.
- Handling Imbalanced Data
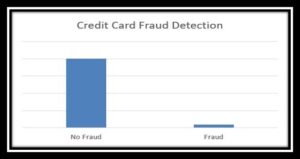
What is Imbalanced Data:- The dataset where the dataset is not balanced it means there is a huge difference in the values given in the data set.
For example:–

In the above data the no fraud is high and the fraud data is very low so that it means the data is not normalize or balanced.
How we can handle the imbalanced data in the dataset
We can handle the imbalanced data by few methods
1.Proper Evaluation Metric:- In this if the value of accuracy increases the chance of accurate value will increase and it will decrease the imbalanced data
Accuracy=Correct prediction upon the total no of prediction of the value
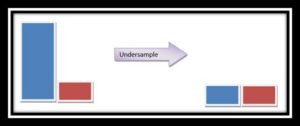
2.Oversampling and Undersampling:- When there is a imbalanced data we can easily oversample the minority class it is called Oversampling. When we randomly delete the rows from the majority class to match the minority class this is called Undersampling. After the sampling of the data the data we get is the balanced data

Summary:- In this blog we get to know about how to deal with the outliers and the imbalanced data in the dataset.


