Features
- Lectures - 7
- Duration - 4 Weeks
- Case Studies and Assessment - 5+
- Delivery Mode - Online/Offline
- Batches - Weekdays/Weekend
- Capstone Projects - 5 projects( Choose anyone)
Business Intelligence and Data Warehousing are two different skills but closely linked to each other to get success for businesses. Extracting data from databases and visualizing it to find patterns and improve business is an important task nowadays. To help businesses grow it is essential to look at our historical data. This is the first step to enter into the world of analytics.
Program Overview
- This program is specially designed to give a strong foundation to those who want to learn Business Intelligence. You will get a brief knowledge on Tableau reporting and SQL querying. After completing this course, you will be able to extract, manipulate data from RDBMS and create reports and dashboard in Tableau.
Program Structure
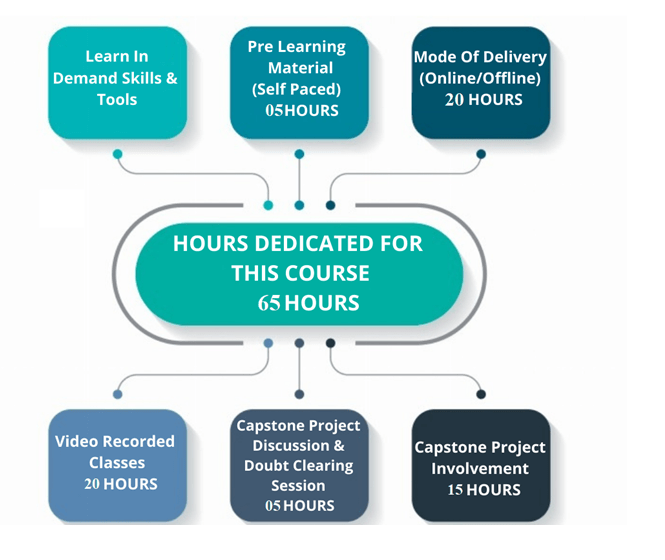
- Pre-Learning: Before you come in, get ready for the program. You will get a series of online recorded tutorials to understand the structure of Business Intelligence.
- 20 Hours Program: Here, you will get Hands-on Experience on Creating Dashboards, reporting charts and story-telling through Tableau. Extracting, manipulating and transforming data through SQL.
- Post Program: Learning does not stop here. After completing the Program, you will work on Project, Assignments. Doubt clearing is also provided. You will be working on any one capstone project from the list of few projects on your choice.
Eligibility:
- Education – Graduate in Math, Science, Commerce, Statistics, Economics or Management
- Work Exp – Work Experience- Fresher/Experienced in any disciplinary field.

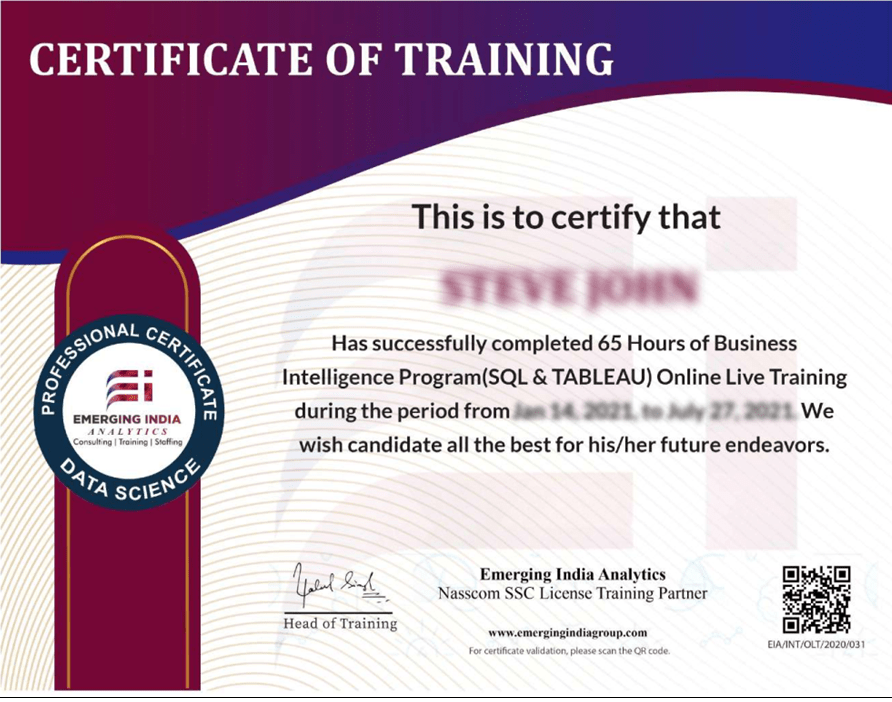
Sample Certificate

-
SQL [8 hours]
BASIC OF DATABASE, TYPES OF DATA BASE, DATA TYPES, SQL OPERATORS, EXPRESSION (BOOLEAN, DATE, NUMERIC), CREATE, INSERT, DROP, TRUNCATE, DELETE, ALTER, UPDATE, SELECT, RANGE OPERATER, IN, WILDCARD, LIKE CLAUSE, CONSTRAINT, AGGREGATION FUNCTION, GROUP BY, ORDER BY, HAVING, JOINS, CASE, COMPLEX QUERIES
-
Tableau [12 hours]
TABLEAU PRODUCTS, INSTALLATION OF TABLEAU DESKTOP/PUBLIC, CONNECTING TO DATABASES, REPLACING DATASOURCE, TABLEAU CANVAS INTERFACE DATA TYPES, DRILL DOWN, HIREARCHIES, MEASURES, DIMESIONS, SORTING, GROUPING, PARAMETER, SETS, COMBINE, DATA BLENDING, FILTER, MARKS CARD, DUAL AXIS, CALCULATED FIELD, VISUALZATION, CANVAS FORMATING, DASHBOARD CREATION
-
Program Benefits
- ✔️ Cutting Edge Curriculum: Hand crafted Course content made by Experts from various Industries. Learn through Practical case studies and multiple projects.
- ✔️ Build Solid Foundation: 20 hours focused course on Business Intelligence.
- ✔️ On the Go Learning: Online accessible E-learning Material, recorded lectures, case studies and Research Paper through our system.
- ✔️ Industry Mentorship: Get 1 to 1 guidance from Industry experts and start your career in Data Science.
-
Skills you will possess post program
-
Capstone Projects
- ✔️ The most effective way to learn Data Science is to learn practically. The candidate will get problem statements and will have to perform a data visualization dashboard on the same.
- ✔️ Climate Change Earth Surface Temp
- ✔️ Airbnb Listing In NYC
- ✔️ C02 Emission By London Borough
- ✔️ Eurovision 98_10
- ✔️ FIFA World Cup Result
- ✔️ Fires From Space Australia & New Zealand
- ✔️ Hollywood’s Most Profitable
- ✔️ Netflix Titles


