
Hey Merchant!
Have your sales stagnated? Do you want to increase sales revenue and/or decrease overhead but don’t know how to do so in an intelligent, data-driven manner? Consider work of the past participant of Emerging India who conducted a market basket analysis (M.B.A.) of your data so as to unearth insights to help you maximize sales, minimize expenses, and maximize profits.
In one such analysis of sales data, our group employed the Python programming language to assess sales data from a bakery client, utilizing multiple approaches with varying degrees of bias.
Beginning with a dataset of largely non-numerical data, we undertook data preprocessing to prepare the data for analyses. This preprocessing involved feature selection via one-hot, label, & ordinal encoding methods, ensuring the absence of null values, feature elimination by deleting unhelpful attributes, and dataset reorganization.
Before we delved into the machine learning-based M.B.A., we conducted exploratory data analysis (E.D.A.) to scrutinize the dataset in an unbiased fashion. This E.D.A. involved the computation of measures of central tendency & dispersion for each attribute, the determination of correlations across variables, and various & sundry colorful & engaging data visualizations within & across features (histograms, bar plots, pie-plots, etc.). Our E.D.A. revealed which days resulted in more sales, which times of day resulted in more sales, and which items were most popular. Thus informed, we recommended to our client multiple measures that they could take to increase sales revenue or decrease operational costs.
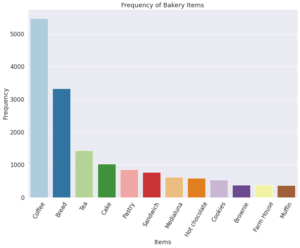
Figure 1. Bar Plot for the frequency of Bakery Items. Coffee, bread, and tea are the most frequently bought items.
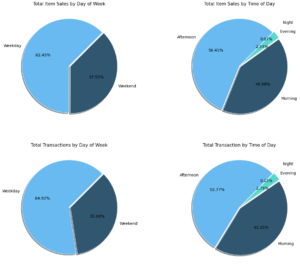
Figure 2. Pie Plots for total sales and transactions by Day of Week. Pie Plots for total item sales and transactions by Time of Day.
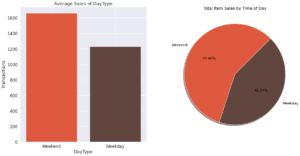
Figure 3. Bar Plot for Transactions by days of week and Pie Plot for total item sales by time of day.
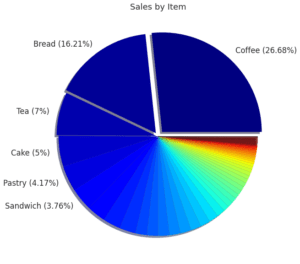
Figure 4. Pie Plot for the frequency of baker items sold.
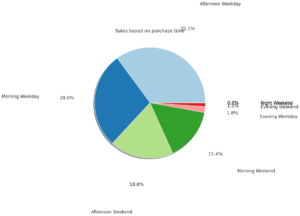
Figure 5. Pie Plot for frequency of sales based on time of day/week. Weekday afternoons contain the most purchases.
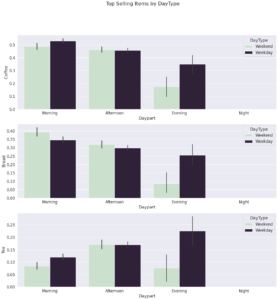
Figure 6. Bar Plots for top selling items based on type of day. X-axis consists of time of day and Y-axis for items.
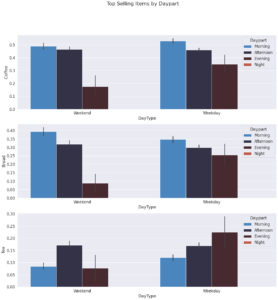
Figure 7. Bar Plots for top selling items based on parts of the day. X-axis consists of the type of day and Y-axis for items.
Resulting from our E.D.A., we advise our client of the following:
- As fewer that 1% of sales occurred during the hours designated as night and only 2.5% during the hours designated as evening:
- NOT OPERATING DURING THESE HOURS should likely increase profits by decreasing the operational costs (e.g.: employee salary/ wages, utilities, insurance premiums for operating a cash business during periods more prone to (potentially violent) robbery/ theft, etc.) to a degree that more than offsets any loss in sales revenue;
- this recommendation must be weighed against the grave inconvenience that such a dramatic truncation of operating hours would have on the patrons (especially dedicated/ loyal night-time customers).
- As folks love coffee, bread, tea, pastries, cakes, & sammiches:
- INCREASING STOCK* & VARIETY of such items might increase sales revenue;
- as might CREATING PROMOTIONAL OFFERS tailored to the sale of these items; this insight should dovetails w/ those from the Market-Basket Analysis.
- NOT OPERATING DURING THESE HOURS should likely increase profits by decreasing the operational costs (e.g.: employee salary/ wages, utilities, insurance premiums for operating a cash business during periods more prone to (potentially violent) robbery/ theft, etc.) to a degree that more than offsets any loss in sales revenue;
As part of our efforts to determine which items were more closely associated with others, we progressed to using an unsupervised learning algorithm (the K-Modes Clustering Algorithm) to group items.
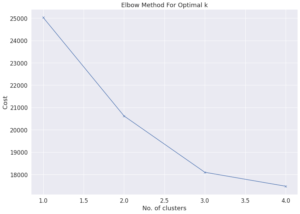
Figure 8. Elbow curve for k modes clustering.
Finalizing the analysis with a supervised machine learning approach, market basket analysis using the association rules framework, we segregated item groupings based on the support value criterion designated by our a priori algorithm, then we finalized the item groupings based on the confidence value criterion similarly designated. Finally, we computed lift value scores for the selected item groupings so as to establish the association rules that were the ultimate result of our M.B.A.
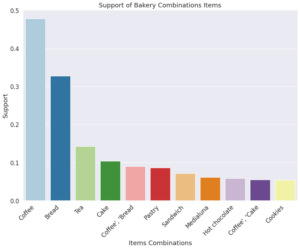
Figure 9. Bar Plot for the support of bakery combination items.
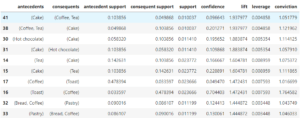
Figure 10. Association rule for combination of bakery items frequently bought together.
With this work, we were able to inform the client of which items predisposed the purchasing of which other items most robustly; and to suggest to the client that they 0. manage their just-in-time supply chain parameters appropriately, 1. alter slotting fees accordingly, 2. co-localize such associated items, and/or 3. offer promotional enticements linking such items as:
- increasing slotting fees for cake, toast, bread, & pastries vendors to place their wares near the coffee, hot chocolate, & tea machines;
- crafting buy-one-get-one-50%-off and buy-one-get-one-free promotional offers encouraging the co-purchase of any combination of coffee, tea, hot chocolate, toast, bread, cake, & pastries;
- co-localizing toast, bread, cake, & pastries items;
- stocking a greater variety of the items that sell like hotcakes: coffee, tea, hot chocolate, toast, bread, cake, & pastries;
- taking appropriate steps to minimize the probability of running out of (or low on*) the best selling items;
- considering increasing the sales of poorly selling items by co-localizing them with hot sellers.
In so doing, we utilized various & sundry data science libraries (pandas, numpy, matplotlib’s pyplot, seaborn, KModes, and apriori & association_rules from mlextend’s frequent_patterns) to identify meaningful & potentially profitable discernments from a simple sales transactions dataset.


